
Businesses are increasingly relying on mobile-first, data-driven applications to improve customer engagement and deliver actionable insights. Data visualization is at the core of this transformation, helping companies interpret complex datasets through interactive charts, dashboards, and analytics tools. React chart libraries play a pivotal role in this process, enabling developers to build high-performance Android apps, iOS apps, and web dashboards that are visually appealing, responsive, and fully optimized for SEO and mobile performance.
By integrating the latest React chart libraries, businesses can create real-time, AI-powered analytics dashboards, improve user retention,These libraries are fully compatible with React Native, hybrid apps, and progressive web apps (PWAs), ensuring a seamless experience across devices.
Why React Chart Libraries Are Essential
The digital landscape in the USA is shifting towards mobile-first user experiences, AI-driven insights, and interactive visual content. Using React chart libraries provides multiple benefits:
Mobile optimization for Android and iOS apps
Faster load speeds and smooth animations
Integration with AI analytics and machine learning models
Cross-platform consistency for hybrid and PWA applications
Companies leveraging these libraries can improve engagement metrics, reduce bounce rates, and enhance overall app performance.
1. Recharts: Mobile-Optimized and Highly Customizable
Recharts remains a top choice for interactive mobile and web applications. Its component-based architecture allows developers to build line charts, bar charts, area charts, and pie charts effortlessly. Key features include:
SVG-based rendering for high-quality graphics on Android and iOS
Fully responsive and mobile-friendly layouts
Support for tooltips, legends, and animations
AI analytics integration for real-time data visualization
Recharts ensures fast mobile performance, a better user experience, and SEO advantages due to reduced load times and improved engagement metrics.
2. Victory: Scalable Charts for Mobile and Web Apps
Victory is a modular React chart library designed for both React and React Native apps. It is ideal for enterprise-grade dashboards, fintech apps, and AI-driven analytics platforms. Features include:
Stacked bar charts, scatter plots, and advanced visualizations
High compatibility with Android and iOS devices
Interactive and animated charts for enhanced engagement
Integration with modern AI tools for predictive analytics
Victory is especially useful for seeking high-quality mobile analytics dashboards that improve time-on-app metrics and Google SEO rankings.
3. Chart.js with React Wrapper: Flexible and Performance-Driven
Chart.js, combined with react-chartjs-2, is a top choice for developers seeking fast, mobile-first charts. Features include:
Doughnut, radar, bubble, and mixed chart types
Responsive design optimized for Android and iOS apps
Lightweight code for faster load times and better Core Web Vitals
Integration with AI dashboards for predictive analytics
This makes Chart.js ideal for e-commerce apps, SaaS dashboards, and mobile reporting tools targeting USA users.
4. Nivo: Advanced Charts with Mobile Responsiveness
Nivo provides highly customizable and animated charts for React apps. Key benefits include:
Heatmaps, treemaps, line charts, and radial charts
Mobile-first design for Android and iOS devices
Accessibility compliance for inclusive app experiences
Integration with AI-powered analytics and business intelligence platforms
Businesses can leverage Nivo for real-time analytics apps that improve engagement and retention.
5. React-Vis: Reliable Charts for Real-Time Dashboards
Developed by Uber, React-Vis remains reliable for interactive dashboards and mobile apps. Key highlights:
Simple API for fast implementation
Support for real-time data updates
Mobile-first design for Android and iOS
Integration with AI and machine learning analytics
React-Vis is perfect for fintech apps, logistics dashboards, and data-driven mobile applications targeting USA users.
6. ApexCharts with React: High-Performance and Interactive
ApexCharts, paired with react-apexcharts, is ideal for real-time analytics, financial dashboards, and interactive reporting tools. Features include:
Radial bar, mixed charts, and scatter charts
Touch-friendly interactions for mobile devices
Dynamic data updates for real-time visualization
Seamless integration with AI analytics platforms
ApexCharts improves user engagement, retention, and SEO performance through mobile-optimized, interactive dashboards.
Trends for React Chart Libraries and Mobile Apps
An app developers must focus on:
Mobile-first design and PWAs
Interactive charts for better engagement metrics
AI and machine learning integration for predictive dashboards
Fast load times and optimized Core Web Vitals
Voice-search optimization with descriptive chart labels
Implementing these trends ensures apps rank higher on Google, deliver better user experiences, and drive business growth in the competitive USA market.
Creating user-friendly, top React Chart libraries is difficult. It is not advisable to spend an excessive amount of time producing visualization. Data is not aesthetically attractive on its own, but we can make it so. Charts make facts visually appealing and simpler to comprehend and remember. People are more engaged with information when they can concentrate on pictures.
What Are React Chart Libraries?
To understand React Chart libraries, you must first understand the React Environment. Many data visualization frameworks ease the development of interactive, responsive, and even animated charts that simplify data visualization. Hence facilitating the integration of line, pie, bar, and candlestick charts into React and Web Applications Development. A React chart library, called reacting applications, enables
React Data visualization in the form of React graph visualization libraries. These are scalable applications that aid in managing data. They are responsible for building React Components for a React app while ensuring their long-term functionality and viability.
This enables developers to show how a given feature will function and focus on providing real data. React charts package helps you to effortlessly tackle complicated issues and overcome React data visualization challenges.
The Ultimate How To Choose React Chart Library? A Few Metrics Checklist
GitHub Stats:
GitHub is an excellent tool for storing and managing code for developers. Developers may focus more of their attention on certain repositories based on their traffic. GitHub is reasonably secure, taking the essential efforts to safeguard its users’ information.
NPMJS (Node Package Manager):
The origin of the word NPM can be traced back to when it was first developed as a package manager for Node.js. It positions modules so that node can locate them and intelligently resolves dependency conflicts. NPMJS is highly adaptable to accommodate a vast array of use cases. It is used to publish, find, install, and build Node applications.
NPM Trends:
NPM Trends, a free search engine that analyzes search queries for NPM packages. It gives results with more documentation data, and might provide some insight into the level of support. Its objective is to compare the popularity of two or more packages, providing an alternative to npm. NPM Trends is conceptually comparable to Google Trends.
Stack Overflow Questions:
Stack Overflow assists users in locating the answers they want when they require them. More than 100 million individuals use our public Q&A platform every month to ask questions, learn, and exchange technical expertise. Stack Overflow for Teams, an adaptive knowledge management and collaboration platform, is altering the way people work.
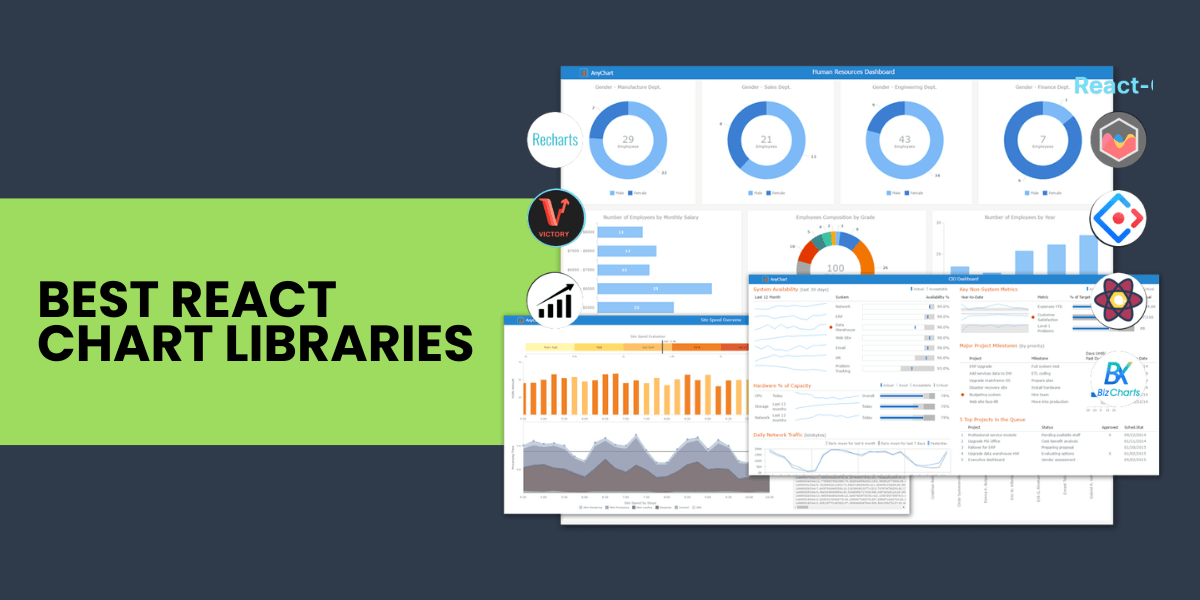
Best React Chart Data Visualization Libraries To Use
The majority of React apps integrate data visualization in some manner. This applies to any language, not just React. Charts, graphs, and other data visualization are now some of the most common components of mobile and online apps.
Before integrating a library or component into your React project, you should consider a number of factors. In addition to React chart libraries’ functionality, you should also examine its documentation, performance impact, library dependencies, and licensing and maintenance fees.
Victory
Victory is a system of dogmatic, but completely overridable, React components for creating dynamic data visualization. Victory, like many other React chart libraries on the list, is developed using React and D3. It includes a large selection of completely configurable charts out of the box.
As beginner-friendly, it offers SVG drawing capability and customizable animations of excellent quality. Additionally, Victory delivers responsive charts that function effectively on all screen sizes.
The ability to create iOS and Android apps is a significant benefit of utilizing Victory. This is because the React Native version of Victory employs a nearly similar API as the online version.
React-vis
React-Vis is one of the most user-friendly React data visualization libraries. If you’ve already dealt with React components, you’ll find it simple to utilize the react-vis components since they superficially resemble.
React-Vis allows the development of several sorts of React data visualization charts, including line, bar, and pie charts, among others. It supports animated charts driven by React Motion and gives appealing, configurable charts out of the box. React-Vis also supports drawing in Canvas and SVG. React-Vis does not need in-depth knowledge of any data visualization libraries.
Recharts
Recharts, one of the best React Chart Libraries, offers easy-to-understand documentation and competent project maintainers.
Recharts adheres to the React component idea by allowing users to create charts using its reusable React components. It just provides drawing support for SVGs and no support for mobile. Recharts offers stunning charts out-of-the-box as it modifies the current component’s properties or by adding new props. By default, the charts are not responsive, but a wrapper component may make them responsive.
Recharts has been around for some time, therefore it has a substantial user base and community. You can quickly begin using recharts by using its CDN or installing it with npm or yarn.
React-chartjs-2
If you have previously used Chart.js with React, there should be no learning curve associated with utilizing this library.react-chartjs-2 is a React wrapper as one of the top React chart Libraries.React-charts-2 is compatible with many Chart.js capabilities.
React-chartjs-2 only supports canvas for drawing and renders on the client side. It has more than 4,300 ratings on GitHub at the time of writing. react-chartjs-2 enables animation and delivers responsive charts by default for the majority of its charts. The library includes components for many chart styles out of the box and also permits customisation.
This library runs very well across all recent web browsers and has a big user base and excellent maintainers. It is installable using npm or yarn.
Nivo
Nivo, among the top React chart libraries, was developed using React and D3 and offers a selection of chart layouts. The package includes HTML, Canvas, and SVG charts, supports client-side and server-side rendering, and is compatible with animations.
It includes a broad variety of attractive charts. Many of the charts it offers are responsive by default, allowing them to fit nicely on screens of varying sizes.
Nivo has more than 9,200 GitHub stars at the time of writing. It has a lively community and active maintainers, and an attractive website with comprehensive documentation. Nivo is installable using npm or yarn.
Visx
Visx, a new name in the domain of React Chart Libraries has achieved around 15.3k stars on GitHub, which is a big accomplishment. The greatest benefit of using Visx as an active repository is that it systematically combines the advantages of React DOM with D3.js.
The Visx creators do not claim that their library is a React chart library. Instead, they see it as a collection of readily re-usable low-level graphical components.
Visx is easy to use and allows you to develop reusable chart components. It uses D3 to conduct the computations.
Rumble Charts
Rumble-charts is one of the simple and refined React chart libraries and data visualization libraries. Rumble Charts is a React component that enables the development of adaptable and modular charts.
According to the library’s creators, React components for generating composable and flexible charts to show your data. Unfortunately, it is not consistently maintained or updated with new features and is D3.js-powered.
It is composable and adaptable. Rumble Charts is based on D3.js and uses Built-in functionality.
Bizcharts
Another well-known company with its own React chart libraries on GitHub is Alibaba. Their charting library emphasizes G2 and React for commercial applications.
BizCharts is compatible with the ES6 React syntax and has a superb template library. However, the documentation and the gallery itself are all in Chinese. Such React chart libraries have a restricted audience that is mostly Asian. It is user-friendly and very expandable.
Additionally, it supports the majority of data visualization charts.
React Stockcharts
React Stockcharts is one of the React chart libraries that is essential for anybody who wishes to examine stock chart data in a number of versatile and intuitive formats. React stock charts are a one-stop solution for web developers searching for a framework for React data visualization Libraries.
You may monitor and show the stock price of any firm over a specific time using charting and range tools. This component features zooming, panning, tooltips, crosshairs, trackballs, period pickers, range selectors, and events to make stock charts more interactive.
It offers highly configurable stock charts and a versatile API for developing top React chart libraries.
Conclusion
When selecting React chart libraries for your project, bear in mind that they were all created to aid developers in accomplishing a certain objective. Analyze their features and functions prior to deciding which one is ideal for your project. Some chart libraries are more suitable for smaller projects, while others are more suitable for bigger ones.
Echoinnovate IT is a Full Stack Observability Platform that enables you to examine application-specific errors. When your hire our dedicated developers, it benefits your business by providing a full picture of your application, including how it functions, where performance bottlenecks occur, which users are most affected, and which faults damage your frontend, backend, and infrastructure code.
FAQs
What are React chart libraries?
React chart libraries aid in the React data visualization, whether in the form of React graph visualization Libraries or any other method.
Why should you use React charts libraries?
It offers the following Listing and Conditional Directives React Chart Library Supports Multiple Data Interactivity with Other People
Is React appropriate for data visualization?
React developers rapidly found that managing D3 and making React work with it was difficult. The community of React data allows you to rapidly and simply create data visualization using reusable React components.
Which is in demand React or React Native?
React Native is in demand for mobile app development, while Reactjs is popular for web development. Reactjs Vs. React Native.
Which React chart library is best for mobile apps?
Recharts, Victory, ApexCharts, React-Vis, Chart.js, and Nivo are all top choices for Android and iOS apps.
How do React charts improve mobile app SEO?
Interactive and fast-loading charts enhance user engagement, reduce bounce rates, and improve Core Web Vitals, all key Google ranking factors in 2025.
Are React chart libraries compatible with React Native?
Yes. Libraries like Victory, React-Vis, and ApexCharts fully support React Native for cross-platform apps.
Can AI tools integrate with React charts?
Yes. AI analytics tools can feed real-time data to charts, enabling predictive dashboards and enhanced mobile engagement.